Tanzania Key Figures
- Population:
- 68.6 million
- GDP growth rate:
- 5.53 %/year
- Energy independence:
- 89.3%
Data of the last year available: 2024
- Total consumption/GDP:*
- 79.4 (2015=100)
- CO2 Emissions:
- 0.27 tCO2/cap
- Rate of T&D power losses:
- 17.2%
* at purchasing power parity
View all macro and energy indicators in the Tanzania energy report
Tanzania Energy News
View all news, archive your new and create your own daily newsletters only on your topics/countries of interest with Key Energy Intelligence
Tanzania Energy Research
Benefit from up to 2 000 up-to-date data series for 186 countries in Global Energy & CO2 data
A data overview is available in the global energy statistics app
Tanzania Total Energy Production & Consumption
Graph: Primary Consumption Trends by Energy Source
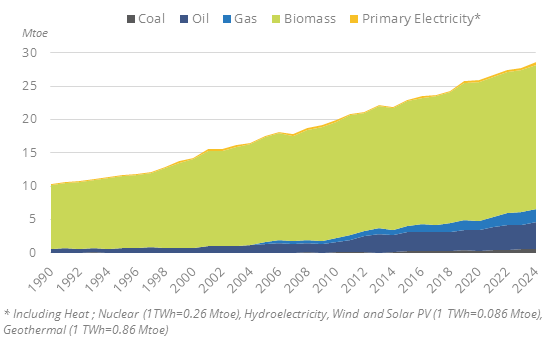
The primary energy consumption has been rising by 2.5%/year since 2010 to 28.6 Mtoe in 2024.
Source: Tanzania energy report
Interactive Chart Tanzania Total Energy Production & Consumption
Source: Global Energy & CO2 data
Benefit from up to 2 000 up-to-date data series for 186 countries in Global Energy & CO2 data
View the detailed fondamentals of the market at country level (graphs, tables, analysis) in the Tanzania energy report
Tanzania Oil Production & Consumption
Tanzania imports its entire consumption of refined products. Imports of oil products are increasing and have more than doubled since 2010, reaching 4.1 Mt in 2024.
The country's last refinery ceased operations in 1999.
Graph: Petroleum Products Production & Consumption
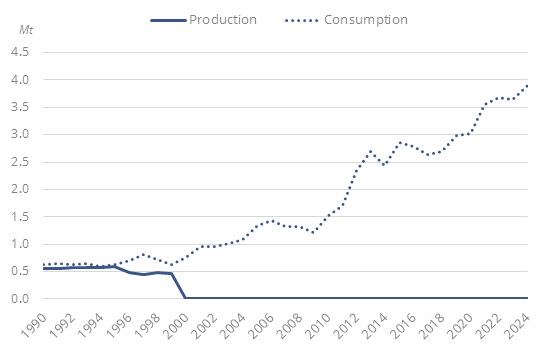
Source: Tanzania energy report
Interactive Chart Tanzania Crude Oil Production & Consumption
Source: Global Energy & CO2 data
Interactive Chart Tanzania Refined Oil Products Production & Consumption
Source: Global Energy & CO2 data
Benefit from up to 2 000 up-to-date data series for 186 countries in Global Energy & CO2 data
Additionally, for more detailed information on refineries, you can request a sample of our EMEA Refineries Dataset
Tanzania Natural Gas Production & Consumption
Gas production started in 2004 and has grown at an average pace of 16% per year since then, reaching 2.44 bcm/year in 2024. Natural gas production is mainly carried out in two fields: Mnazi Bay and Songo Songo.
The country does not import or export natural gas. The only high-pressure gas pipeline mainly serves to transport the resource from its production area in the south of the country (off the Songo songo island) to Daar es Salam. In 2024, around 80% of the gas was used for power generation and the rest in industry.
Source: Tanzania energy report
Interactive Chart Tanzania Gas Production & Consumption
Source: Global Energy & CO2 data
Benefit from up to 2 000 up-to-date data series for 186 countries in Global Energy & CO2 data
Additionally, for more detailed information on the LNG trade, you can request a sample of our EMEA LNG Trade Dataset
Tanzania Coal and Lignite Production & Consumption
Coal production has more than tripled since 2020, reaching 2.5 Mt in 2024.
Graph: Coal Production & Consumption
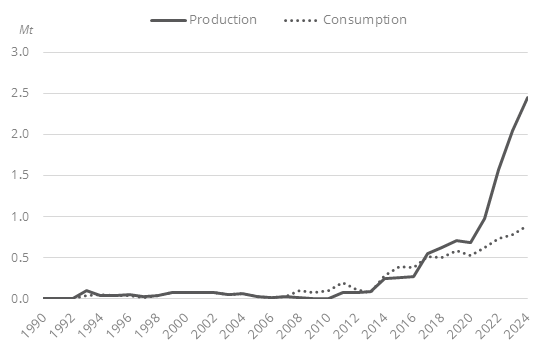
After decades of very low levels, the production of coal in Tanzania started to take off in 2014, with the development of several mines in the country, such as the Ngaka coal mine. An increasing share of the coal production is exported (63% in 2024, compared to 17% in 2019). The rest is used in industry.
Source: Tanzania energy report
Interactive Chart Tanzania Coal and Lignite Production & Consumption
Source: Global Energy & CO2 data
Benefit from up to 2 000 up-to-date data series for 186 countries in Global Energy & CO2 data
View the detailed consumption trends at country level (graphs, tables, analysis) in the Tanzania energy report
Tanzania Renewable in % Electricity Production
Under the framework of the 2010 SE4ALL AA, the country intends to double the share of renewables in its energy mix by 2030 compared to 2010. Tanzania was selected by the Scaling-Up Renewable Energy Programme (SREP), part of the Climate Investment Funds (CIF).
The PSMP 2024 Update forecasts an increase in the share of renewables in the power capacity mix in 2050, from 37% in 2019 to 57% in 2050.
Source: Tanzania energy report
Interactive Chart Tanzania Share of Renewables in Electricity Production (incl hydro)
Source: Global Energy & CO2 data
Benefit from up to 2 000 up-to-date data series for 186 countries in Global Energy & CO2 data
Tanzania GHG emissions and CO2 emissions
In its updated NDC (2021), the country plans to cut its GHG emissions by 30-35% by 2030 compared to a BAU scenario.
Source: Tanzania energy report
Interactive Chart Tanzania CO2 emissions
Source: Global Energy & CO2 data
Benefit from up to 2 000 up-to-date data series for 186 countries in Global Energy & CO2 data
View the detailed consumption trends at country level (graphs, tables, analysis) in the Tanzania energy report