Thailand Key Figures
- Population:
- 71.7 million
- GDP growth rate:
- 2.53 %/year
- Energy independence:
- 47.5%
Data of the last year available: 2024
- Total consumption/GDP:*
- 77.7 (2015=100)
- CO2 Emissions:
- 3.49 tCO2/cap
- Rate of T&D power losses:
- 5.35%
* at purchasing power parity
View all macro and energy indicators in the Thailand energy report
Thailand Energy News
View all news, archive your new and create your own daily newsletters only on your topics/countries of interest with Key Energy Intelligence
Thailand Energy Research
Benefit from up to 2 000 up-to-date data series for 186 countries in Global Energy & CO2 data
A data overview is available in the global energy statistics app
Thailand Total Energy Production & Consumption
Total energy consumption has been decreasing since 2019 (-1.9%/year), reaching 124 Mtoe in 2024. It remained rather stable between 2013-2019 at around 135 Mtoe, after nearly doubling between 2000 and 2013 (+5%/year), reaching a peak at 136 Mtoe. Consumption per capita is low, at 1.7 toe in 2024, at around the same as the Asian average.
Graph: Primary Consumption Trends by Energy Source
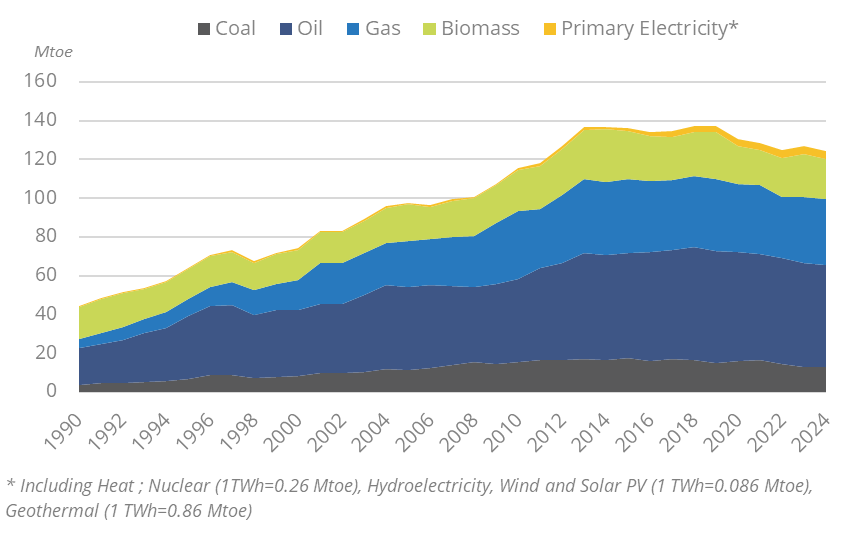
Source: Thailand energy report
Interactive Chart Thailand Total Energy Production & Consumption
Source: Global Energy & CO2 data
Benefit from up to 2 000 up-to-date data series for 186 countries in Global Energy & CO2 data
View the detailed fondamentals of the market at country level (graphs, tables, analysis) in the Thailand energy report
Thailand Oil Production & Consumption
The production of liquid hydrocarbons (crude oil and NGL) increased in 2024 (+11%), reaching 13.6 Mt, after decreasing from 2016 to 2023 (-6.5%/year), Previously, it had increased rapidly between 2000 and 2016 (+6%/year).
The country is an importer of crude oil and NGL: exports have grown by 1.4%/year since 2015, reaching 50 Mt in 2024. Exports increased since 2022 (+14%/year) to reach 1 Mt in 2024. Crude oil and NGL domestic consumption have been rising since 2022 (+2%/year) to reach 62 Mt in 2024, after decreasing by 2%/year from 2016 to 2022.
Source: Thailand energy report
Interactive Chart Thailand Crude Oil Production & Consumption
Source: Global Energy & CO2 data
Interactive Chart Thailand Refined Oil Products Production & Consumption
Source: Global Energy & CO2 data
Benefit from up to 2 000 up-to-date data series for 186 countries in Global Energy & CO2 data
Additionally, for more detailed information on refineries, you can request a sample of our Asia Refineries Dataset
Thailand Natural Gas Production & Consumption
The marketed gas production jumped by 9% in 2024 to 23 bcm, after remaining steady in 2022 and 2023 as PTTEP boosted production from maturing fields. Prior to this, gas production had also decreased by around 30% between 2014 and 2021. It increased rapidly from 17 bcm in 2000 to 35 bcm in 2014.
Natural gas domestic consumption has been declining by around 3%/year since 2018, reaching 38 bcm in 2024.
Source: Thailand energy report
Interactive Chart Thailand Gas Production & Consumption
Source: Global Energy & CO2 data
Benefit from up to 2 000 up-to-date data series for 186 countries in Global Energy & CO2 data
Additionally, for more detailed information on the LNG trade, you can request a sample of our Asia LNG Trade Dataset
Thailand Coal and Lignite Production & Consumption
The production of lignite has decreased by 5%/year since 2021, reaching 13 Mt in 2023 and remained steady in 2024. This decrease run at the same rate as over 2011-2020; it rebounded by 7% in 2021.
The country's coal imports slightly increased (+1%) in 2024, reaching 18.6 Mt. Previously, they decreased by 9%/year between 2019 and 2021, because of a fall in industrial consumption, while increased competition from gas and renewables reduced the share of coal and lignite in the country's power mix.
Source: Thailand energy report
Interactive Chart Thailand Coal and Lignite Production & Consumption
Source: Global Energy & CO2 data
Benefit from up to 2 000 up-to-date data series for 186 countries in Global Energy & CO2 data
View the detailed consumption trends at country level (graphs, tables, analysis) in the Thailand energy report
Thailand Renewable in % Electricity Production
The Draft AEDP 2024-2037 (2024) aims to increase the share of renewables in the energy mix to achieve carbon neutrality by 2050. The plan targets 73 GW of renewable capacity by 2037, i.e. 45 GW more than in the previous AEDP (2018-2037); over half of this capacity will rely on ground-mounted and floating solar (: 39 GW), the rest being distributed as follows: 9 GW wind, 5.5 GW biomass, and 3 GW hydropower.
Source: Thailand energy report
Interactive Chart Thailand Share of Renewables in Electricity Production (incl hydro)
Source: Global Energy & CO2 data
Benefit from up to 2 000 up-to-date data series for 186 countries in Global Energy & CO2 data
Learn more about renewables in the Mini grid Africa & Asia markets for village electrification
Thailand GHG emissions and CO2 emissions
In its last updated NDC (2022), the country raised its target to a 30% reduction in GHG emissions from a BAU scenario by 2030 (20% before) and up to 40% subject to international support. It also included the objectives of carbon neutrality by 2050 and net zero GHG emissions by 2065-2070.
Source: Thailand energy report
Interactive Chart Thailand CO2 emissions
Source: Global Energy & CO2 data
Benefit from up to 2 000 up-to-date data series for 186 countries in Global Energy & CO2 data
View the detailed consumption trends at country level (graphs, tables, analysis) in the Thailand energy report