Venezuela Key Figures
- Population:
- 28.4 million
- GDP growth rate:
- 5.30 %/year
- Energy independence:
- 100%
Data of the last year available: 2024
- Total consumption/GDP:*
- 207 (2015=100)
- CO2 Emissions:
- 2.28 tCO2/cap
- Rate of T&D power losses:
- 20.5%
* at purchasing power parity
View all macro and energy indicators in the Venezuela energy report
Venezuela Energy News
View all news, archive your new and create your own daily newsletters only on your topics/countries of interest with Key Energy Intelligence
Venezuela Energy Research
Benefit from up to 2 000 up-to-date data series for 186 countries in Global Energy & CO2 data
A data overview is available in the global energy statistics app
Venezuela Total Energy Production & Consumption
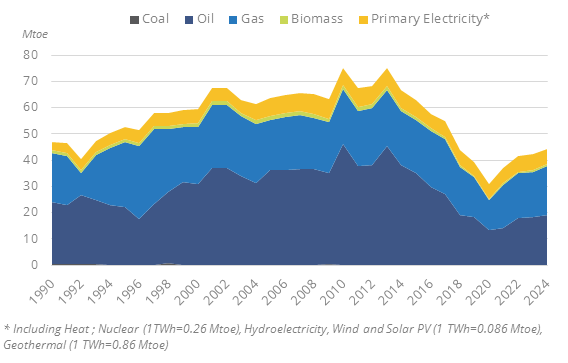
Due to deep political tensions and the economic crisis, the primary energy consumption in Venezuela fell drastically from 2013 to 2020, by about 12% per year on average, to reach a record-low 31 Mtoe in 2020. Since 2021, it grew by about 10% per year to reach 44 Mtoe in 2024, which is still around 60% below its peak at 75 Mtoe in 2013.
Graph: Primary Consumption Trends by Energy Source
Source: Venezuela energy report
Interactive Chart Venezuela Total Energy Production & Consumption
Source: Global Energy & CO2 data
Benefit from up to 2 000 up-to-date data series for 186 countries in Global Energy & CO2 data
View the detailed fondamentals of the market at country level (graphs, tables, analysis) in the Venezuela energy report
Venezuela Oil Production & Consumption
Crude oil production dropped by 77% between 2013 and 2020 and has increased by 9%/year since, reaching 53 Mt in 2024.
Approximately 2/3 of the oil production is exported. In addition, Venezuela exported 1 Mt of oil products in 2024.
Source: Venezuela energy report
Interactive Chart Venezuela Crude Oil Production & Consumption
Source: Global Energy & CO2 data
Interactive Chart Venezuela Refined Oil Products Production & Consumption
Source: Global Energy & CO2 data
Benefit from up to 2 000 up-to-date data series for 186 countries in Global Energy & CO2 data
Additionally, for more detailed information on refineries, you can request a sample of our America Refineries Dataset
Venezuela Natural Gas Production & Consumption
The natural gas production dropped by 47% from 2016 to 2020 and has since rebounded by 13%/year, reaching 23 bcm in 2024.
Only a quarter of the gas production is marketed; a strong proportion is re-injected (40%). That production is only used to supply the domestic market, with the largest part being used for the production of electricity and in industry.
Source: Venezuela energy report
Interactive Chart Venezuela Gas Production & Consumption
Source: Global Energy & CO2 data
Benefit from up to 2 000 up-to-date data series for 186 countries in Global Energy & CO2 data
Additionally, for more detailed information on the LNG trade, you can request a sample of our America LNG Trade Dataset
Venezuela Coal and Lignite Production & Consumption
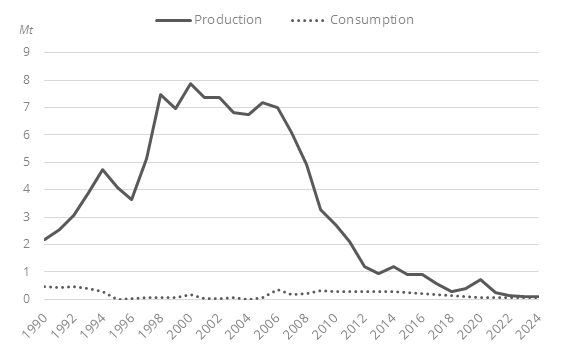
The production of coal has dropped dramatically since 2006 (0.1 Mt in 2024). It increased strongly between 1990 and 2000, from 2 Mt to 8 Mt, and then remained stable at around 7 Mt until 2006.
Graph: Coal Production & Consumption
Source: Venezuela energy report
Interactive Chart Venezuela Coal and Lignite Production & Consumption
Source: Global Energy & CO2 data
Benefit from up to 2 000 up-to-date data series for 186 countries in Global Energy & CO2 data
View the detailed consumption trends at country level (graphs, tables, analysis) in the Venezuela energy report
Venezuela GHG emissions and CO2 emissions
The updated NDC (2021) confirmed the objective set at COP21 in Paris (2015), to reduce GHG emissions by 20% by 2030 compared to a BAU projection.
Source: Venezuela energy report
Interactive Chart Venezuela CO2 emissions
Source: Global Energy & CO2 data
Benefit from up to 2 000 up-to-date data series for 186 countries in Global Energy & CO2 data
View the detailed consumption trends at country level (graphs, tables, analysis) in the Venezuela energy report