Chile Key Figures
- Population:
- 19.8 million
- GDP growth rate:
- 2.64 %/year
- Energy independence:
- 39.3%
Data of the last year available: 2024
- Total consumption/GDP:*
- 97.5 (2015=100)
- CO2 Emissions:
- 4.00 tCO2/cap
- Rate of T&D power losses:
- 6.01%
* at purchasing power parity
View all macro and energy indicators in the Chile energy report
Chile Energy News
View all news, archive your new and create your own daily newsletters only on your topics/countries of interest with Key Energy Intelligence
Chile Energy Research
Benefit from up to 2 000 up-to-date data series for 186 countries in Global Energy & CO2 data
A data overview is available in the global energy statistics app
Chile Total Energy Production & Consumption
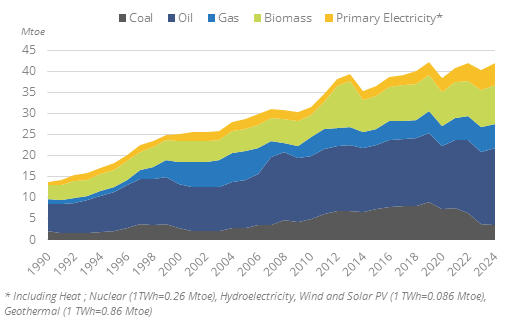
Total energy consumption increased by 4% in 2024 to 42 Mtoe, after decreasing by 4% in 2023 and increasing by 5%/year from 2020 to 2022. It progressed by 3.6%/year between 2014 and 2019 and dropped by 9% in 2020.
Graph: Primary Consumption Trends by Energy Source
Source: Chile energy report
Interactive Chart Chile Total Energy Production & Consumption
Source: Global Energy & CO2 data
Benefit from up to 2 000 up-to-date data series for 186 countries in Global Energy & CO2 data
View the detailed fondamentals of the market at country level (graphs, tables, analysis) in the Chile energy report
Chile Oil Production & Consumption
Oil production is negligible (0.4 Mt in 2024). Imports consisted of 9.9 Mt of crude oil and 9.3 Mt of oil products in 2024.
The Arica pipeline makes oil trades possible with Bolivia. Through an agreement signed in 1992, Chile authorized the bidirectional use of the pipeline and the storage of oil, rendering facilities suitable for both exportation and importation.
Source: Chile energy report
Interactive Chart Chile Crude Oil Production & Consumption
Source: Global Energy & CO2 data
Interactive Chart Chile Refined Oil Products Production & Consumption
Source: Global Energy & CO2 data
Benefit from up to 2 000 up-to-date data series for 186 countries in Global Energy & CO2 data
Additionally, for more detailed information on refineries, you can request a sample of our America Refineries Dataset
Chile Natural Gas Production & Consumption
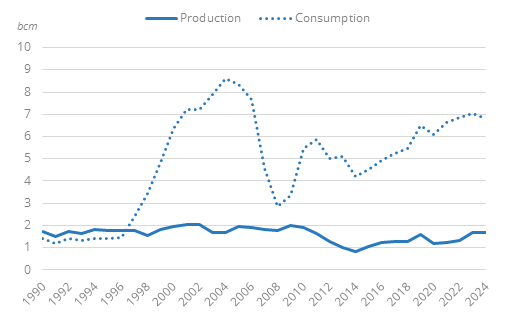
Gas production is low (1.7 bcm in 2024) and is primarily intended for the supply of the Methanex methanol plant in the south of Chile.
Gas imports have been rising since 2008 with the commissioning of two LNG import terminals in 2009 and 2010. Imports grew by 11%/year until 2022 and dropped by 4% in 2024 (5.1 bcm).
Graph: Gas Production & Consumption
Source: Chile energy report
Interactive Chart Chile Gas Production & Consumption
Source: Global Energy & CO2 data
Benefit from up to 2 000 up-to-date data series for 186 countries in Global Energy & CO2 data
Additionally, for more detailed information on the LNG trade, you can request a sample of our America LNG Trade Dataset
Chile Coal and Lignite Production & Consumption
Coal production has almost ceased since 2021 (0.2 Mt in 2024). Production rose from 0.7 Mt in 2012 to 4.2 Mt in 2014 with the start of the Mina Invierno coal mine.
Coal consumption has decreased by 20%/year since 2021 because of the shut-down of 1.3 GW of coal-fired capacity. Previously, coal consumption had increased regularly since 2000, reaching 14 Mt in 2019 (4.6 Mt in 2000 and 7 Mt in 2010) with the commissioning of several coal power plants.
Graph: Coal Production & Consumption
Source: Chile energy report
Interactive Chart Chile Coal and Lignite Production & Consumption
Source: Global Energy & CO2 data
Benefit from up to 2 000 up-to-date data series for 186 countries in Global Energy & CO2 data
View the detailed consumption trends at country level (graphs, tables, analysis) in the Chile energy report
Chile Renewable in % Electricity Production
The development of renewables is under the responsibility of the Sustainable Energy Department of the Ministry of Energy.
The 2022 National Energy Policy sets targets of 80% of the electricity mix from renewables in 2030 (60% from non-conventional renewables) and 100% zero emissions in 2050.
The National Heat and Cooling Strategy (2021) targets 80% of "sustainable" energy used for heat and cooling by 2050 (and 45% by 2030). It seeks to enhance the electrification of thermal needs, replacing fossil fuels and firewood, and to tackle fuel poverty.
Source: Chile energy report
Interactive Chart Chile Share of Renewables in Electricity Production (incl hydro)
Source: Global Energy & CO2 data
Benefit from up to 2 000 up-to-date data series for 186 countries in Global Energy & CO2 data
Chile GHG emissions and CO2 emissions
In its revised NDC (2020), Chile is committed to becoming carbon neutral in 2050 and set an intermediate objective of 95 MtCO2eq emissions (excluding LULUCF) by 2030 (a 23% cut compared to its first NDC).
In 2022, a Climate Law came into force, confirming carbon neutrality by 2050. The Environment Ministry is in charge of assessing the progress every 5 years. The national targets set by the NDC and LTS will be set out in regional and local climate policies.
Source: Chile energy report
Interactive Chart Chile CO2 emissions
Source: Global Energy & CO2 data
Benefit from up to 2 000 up-to-date data series for 186 countries in Global Energy & CO2 data
View the detailed consumption trends at country level (graphs, tables, analysis) in the Chile energy report