Congo Key Figures
- Population:
- 6.18 million
- GDP growth rate:
- 1.91 %/year
- Energy independence:
- 100%
Data of the last year available: 2023
- Total consumption/GDP:*
- 155 (2015=100)
- CO2 Emissions:
- 0.63 tCO2/cap
- Rate of T&D power losses:
- 50.3%
* at purchasing power parity
View all macro and energy indicators in the Congo energy report
Congo Energy News
View all news, archive your new and create your own daily newsletters only on your topics/countries of interest with Key Energy Intelligence
Congo Energy Research
Benefit from up to 2 000 up-to-date data series for 186 countries in Global Energy & CO2 data
A data overview is available in the global energy statistics app
Congo Total Energy Production & Consumption
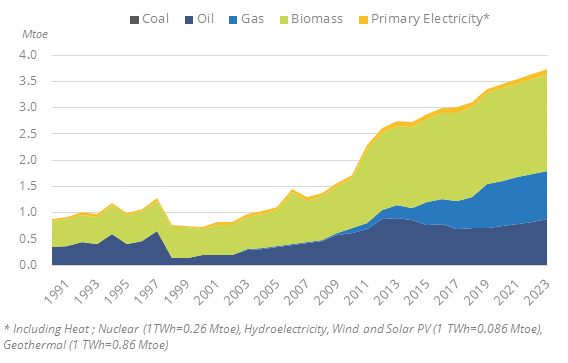
Total energy consumption has increased by 3%/year since 2020 to 3.7 Mtoe in 2023, after a strong growth of 8% in 2019. In 2023, total energy consumption per inhabitant was around 0.6 toe (0.2 toe without biomass), in line with the Sub-Saharan Africa average.
Graph: Primary Consumption Trends by Energy Source
Source: Congo energy report
Interactive Chart Congo Total Energy Production & Consumption
Source: Global Energy & CO2 data
Benefit from up to 2 000 up-to-date data series for 186 countries in Global Energy & CO2 data
View the detailed fondamentals of the market at country level (graphs, tables, analysis) in the Congo energy report
Congo Oil Production & Consumption
Oil production has increased by 5% in 2023 to 14.3 Mt, after declining by 20% between 2019 and 2022. it rose by 21% in 2018 with the commissioning of several new fields (Moho Nord deep offshore, Lianzi, and Nené Marine). Production had previously been decreasing between 2010 and 2016, following a rapid increase between 2007 and 2010 (+12%/year) with the start of several fields: the first deep offshore field, Moho Bilondo, in 2008 (90 kb/d), the Awa-Paloukou and Ikalou-Ikalou fields (peak production of 13 kb/d for the two fields) in 2008, and the Azurite field (40 kb/d) in 2009.
Source: Congo energy report
Interactive Chart Congo Crude Oil Production & Consumption
Source: Global Energy & CO2 data
Interactive Chart Congo Refined Oil Products Production & Consumption
Source: Global Energy & CO2 data
Benefit from up to 2 000 up-to-date data series for 186 countries in Global Energy & CO2 data
Additionally, for more detailed information on refineries, you can request a sample of our EMEA Refineries Dataset
Congo Natural Gas Production & Consumption
Marketed gas production remained stable in 2023 (1.1 bcm), after a slow growth from 2020 to 2022 (3%/year). It increased very rapidly before, from 0.1 bcm in 2010 to 0.53 bcm in 2015 and 1.05 bcm in 2020 (+15%/year from 2015 to 2020). In 2024, production has strongly (+50%). Most of the production is associated with oil production. Half of the gross gas production is flared or reinjected (33% flared and 17% reinjected in 2024 according to Cedigaz).
Source: Congo energy report
Interactive Chart Congo Gas Production & Consumption
Source: Global Energy & CO2 data
Benefit from up to 2 000 up-to-date data series for 186 countries in Global Energy & CO2 data
Additionally, for more detailed information on the LNG trade, you can request a sample of our EMEA LNG Trade Dataset
Congo Renewable in % Electricity Production
The Ministry of Energy has announced that the country plans to double its power generation capacity to over 1.5 GW by 2030, largely through the development of renewables, especially hydropower projects.
Source: Congo energy report
Interactive Chart Congo Share of Renewables in Electricity Production (incl hydro)
Source: Global Energy & CO2 data
Benefit from up to 2 000 up-to-date data series for 186 countries in Global Energy & CO2 data
Congo GHG emissions and CO2 emissions
In its updated NDC (2021), Congo set an unconditional GHG emission reduction target of 21.5% (excluding forests) compared to a BAU scenario in 2030 and a conditional reduction target of 32%.
Under its BAU scenario, GHG emissions are expected to rise from 11.4 MtCO2eq in 2020 to 15.3 MtCO2eq in 2030, of which 10.2 MtCO2eq from the energy sector. The unconditional reduction target would limit GHG emissions to 12 MtCO2eq in 2030 (of which 9.4 MtCO2eq from the energy sector), while the conditional reduction target could limit them to 7.1 MtCO2eq.
Source: Congo energy report
Interactive Chart Congo CO2 emissions
Source: Global Energy & CO2 data
Benefit from up to 2 000 up-to-date data series for 186 countries in Global Energy & CO2 data
View the detailed consumption trends at country level (graphs, tables, analysis) in the Congo energy report