Greece Key Figures
- Population:
- 10.4 million
- GDP growth rate:
- 2.27 %/year
- Energy independence:
- 22.4%
Data of the last year available: 2024
- Total consumption/GDP:*
- 69.5 (2015=100)
- CO2 Emissions:
- 4.51 tCO2/cap
- Rate of T&D power losses:
- 11.5%
* at purchasing power parity
View all macro and energy indicators in the Greece energy report
Greece Energy News
View all news, archive your new and create your own daily newsletters only on your topics/countries of interest with Key Energy Intelligence
Greece Energy Research
Benefit from up to 2 000 up-to-date data series for 186 countries in Global Energy & CO2 data
A data overview is available in the global energy statistics app
Greece Total Energy Production & Consumption
Primary energy consumption, which had been declining by 2.7%/year between 2010 and 2023, rebounded by 2.2% in 2024 to 19.8 Mtoe. It had increased by 2.4%/year between 1990 and 2005 to 30 Mtoe, before declining by 3.2%/year until 2013, when it stabilised around 23 Mtoe until 2019 (11% fall in 2020).
Graph: Primary Consumption Trends by Energy Source
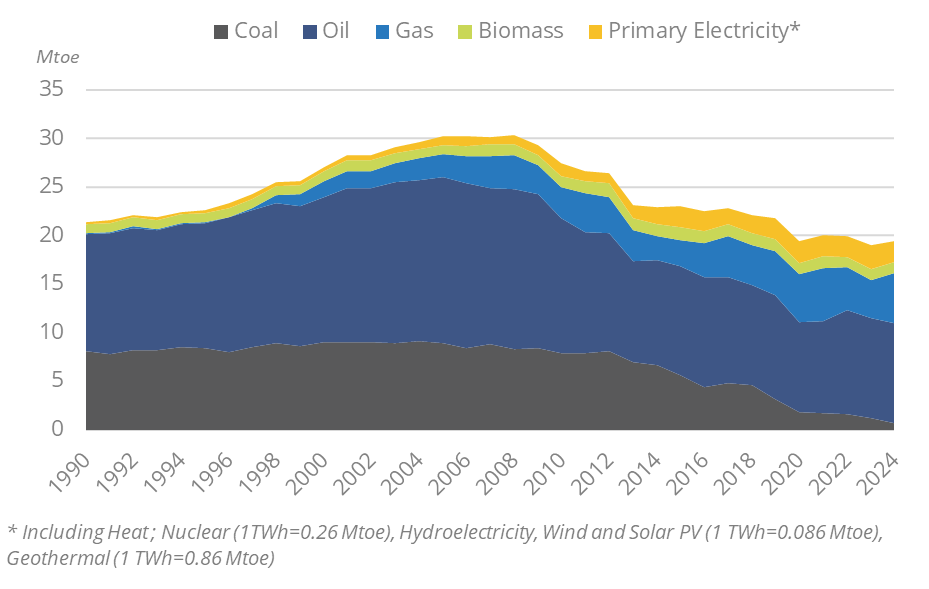
Source: Greece energy report
Interactive Chart Greece Total Energy Production & Consumption
Source: Global Energy & CO2 data
Benefit from up to 2 000 up-to-date data series for 186 countries in Global Energy & CO2 data
View the detailed fondamentals of the market at country level (graphs, tables, analysis) in the Greece energy report
Greece Oil Production & Consumption
All crude oil is imported (28 Mt in 2024). The main suppliers are Iraq (33% in 2024), Kazakhstan (26%), and Libya (15%). Until 2021, Russia was one of the top three exporters to Greece, but imports fell by 76% in 2022 (0 in 2023 and 2024).
Source: Greece energy report
Interactive Chart Greece Crude Oil Production & Consumption
Source: Global Energy & CO2 data
Interactive Chart Greece Refined Oil Products Production & Consumption
Source: Global Energy & CO2 data
Benefit from up to 2 000 up-to-date data series for 186 countries in Global Energy & CO2 data
Additionally, for more detailed information on refineries, you can request a sample of our EMEA Refineries Dataset
Greece Natural Gas Production & Consumption
A large part of the natural gas consumed is imported. Natural gas imports fell by 11% in 2022 and by 16% in 2023, in a context of soaring prices, and rebounded by 29% in 2024 to 6.2 bcm. They doubled between 2014 and 2021 to 6.4 bcm. Imports from Russia via pipeline have historically accounted for most gas imports, and despite EU rules, the share of gas imports from Russia increased from 44% in 2021 (64% of piped gas imports, no LNG) to 54% in 2024 (67% of piped gas imports and 12% of LNG imports). Other major natural gas importers are the United States, Qatar, and Algeria.
Source: Greece energy report
Interactive Chart Greece Gas Production & Consumption
Source: Global Energy & CO2 data
Benefit from up to 2 000 up-to-date data series for 186 countries in Global Energy & CO2 data
Additionally, for more detailed information on the LNG trade, you can request a sample of our EMEA LNG Trade Dataset
Greece Coal and Lignite Production & Consumption
The country produced 6.5 Mt of lignite in 2024 (-40%, after a 24% decrease in 2023). Lignite production has fallen by 14%/year since 2010 (56.5 Mt).
Lignite consumption reached an all-time high in 2004 (72 Mt) and has been falling since then, reaching 5.8 Mt in 2024 (-40% in 2024 alone), i.e. 10 times below its 2010 level. Nearly all the lignite consumption is used by the electricity sector and the current decrease in demand is explained by changes in the power mix (rising gas-fired and renewable generation) and the closure of the last lignite-fired power units.
Source: Greece energy report
Interactive Chart Greece Coal and Lignite Production & Consumption
Source: Global Energy & CO2 data
Benefit from up to 2 000 up-to-date data series for 186 countries in Global Energy & CO2 data
View the detailed consumption trends at country level (graphs, tables, analysis) in the Greece energy report
Greece Renewable in % Electricity Production
The national target, according to the EU Directive on renewables, of 22% of renewables in the final energy consumption in 2021 has not been reached by almost 4 pp (17% in 2021).
Source: Greece energy report
Interactive Chart Greece Share of Renewables in Electricity Production (incl hydro)
Source: Global Energy & CO2 data
Benefit from up to 2 000 up-to-date data series for 186 countries in Global Energy & CO2 data
Learn more about renewables in the European Battery Market Analysis
Greece GHG emissions and CO2 emissions
The updated NECP (2025) aims to cut net GHG emissions (including LULUCF) by over 58% by 2030 (compared to 1990 level), to 43.2 MtCO2eq in 2030 and to zero in 2050, thanks to a sharp reduction in emissions from power generation and transport, increased LULUCF removals, and the use of direct air capture to store CO2.
Source: Greece energy report
Interactive Chart Greece CO2 emissions
Source: Global Energy & CO2 data
Benefit from up to 2 000 up-to-date data series for 186 countries in Global Energy & CO2 data
View the detailed consumption trends at country level (graphs, tables, analysis) in the Greece energy report