Netherlands Key Figures
- Population:
- 18.0 million
- GDP growth rate:
- 0.98 %/year
- Energy independence:
- 31.1%
Data of the last year available: 2024
- Total consumption/GDP:*
- 70.7 (2015=100)
- CO2 Emissions:
- 5.97 tCO2/cap
- Rate of T&D power losses:
- 4.34%
* at purchasing power parity
View all macro and energy indicators in the Netherlands energy report
Netherlands Energy News
View all news, archive your new and create your own daily newsletters only on your topics/countries of interest with Key Energy Intelligence
Netherlands Energy Research
Benefit from up to 2 000 up-to-date data series for 186 countries in Global Energy & CO2 data
A data overview is available in the global energy statistics app
Netherlands Total Energy Production & Consumption
Total energy consumption has been decreasing slightly since 2021 (-3.9%/year), reaching 61 Mtoe in 2024. It was decreasing over 2016-2019 (-0.8%/year), after a slight growth between 2014 and 2016 (+1.5%/year) thanks to the economic recovery, and a decrease by more than 1%/year between 2007 and 2014 due to the economic slowdown.
Graph: Primary Consumption Trends by Energy Source
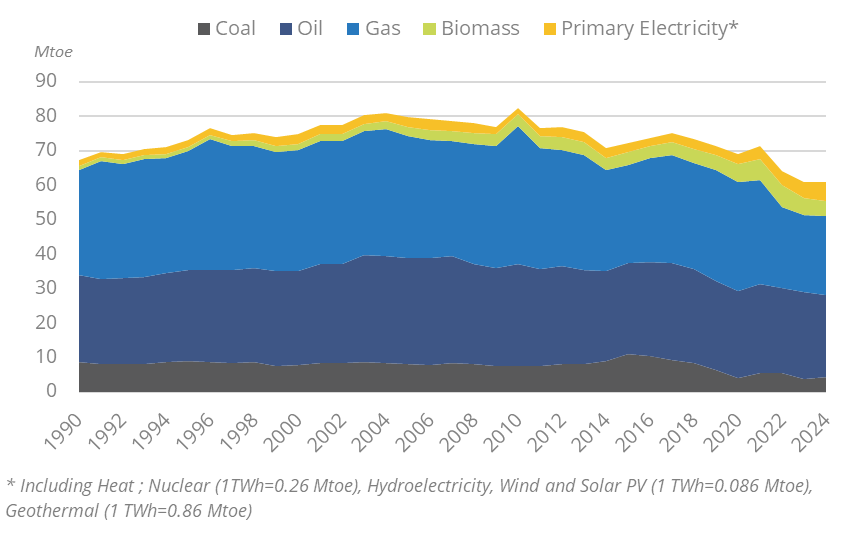
Source: Netherlands energy report
Interactive Chart Netherlands Total Energy Production & Consumption
Source: Global Energy & CO2 data
Benefit from up to 2 000 up-to-date data series for 186 countries in Global Energy & CO2 data
View the detailed fondamentals of the market at country level (graphs, tables, analysis) in the Netherlands energy report
Netherlands Oil Production & Consumption
Crude oil production is low and decreasing (0.6 Mt in 2024). Crude imports (57 Mt in 2024) mainly came from the US. The share of Russia dropped from 31% in 2021 to 0.5% in 2022; in 2023, there were no imports from Russia.
Graph: Crude Oil Production & Consumption
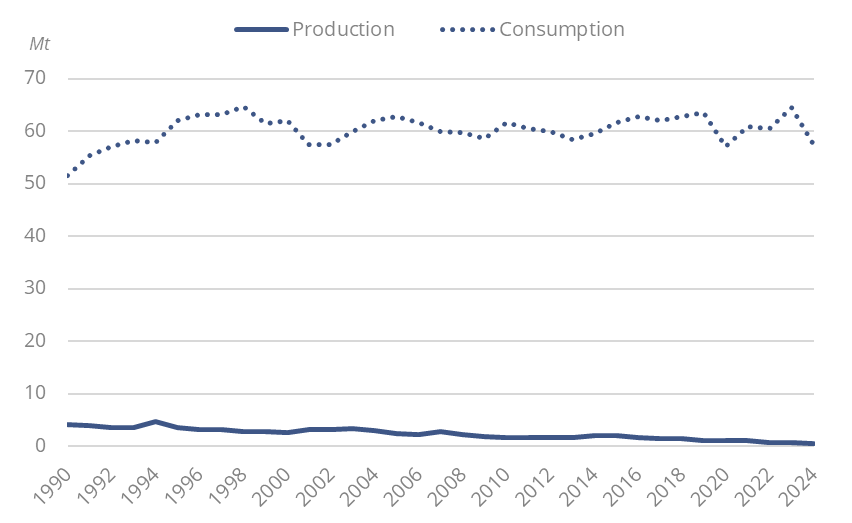
Source: Netherlands energy report
Interactive Chart Netherlands Crude Oil Production & Consumption
Source: Global Energy & CO2 data
Interactive Chart Netherlands Refined Oil Products Production & Consumption
Source: Global Energy & CO2 data
Benefit from up to 2 000 up-to-date data series for 186 countries in Global Energy & CO2 data
Additionally, for more detailed information on refineries, you can request a sample of our EMEA Refineries Dataset
Netherlands Natural Gas Production & Consumption
Gas production has dropped by 89% since 2013, from 87 bcm to 10 bcm in 2024 (-18% in 2024), due to the production cap imposed on the Groningen field.
Source: Netherlands energy report
Interactive Chart Netherlands Gas Production & Consumption
Source: Global Energy & CO2 data
Benefit from up to 2 000 up-to-date data series for 186 countries in Global Energy & CO2 data
Additionally, for more detailed information on the LNG trade, you can request a sample of our EMEA LNG Trade Dataset
Netherlands Coal and Lignite Production & Consumption
The Netherlands imports all its coal consumption. Coal imports decreased by 3% in 2024 to 6.4 Mt, after a 28% decline in 2023 and a 3% increase in 2022. In 2021, imports increased by 41%. Between 2015 and 2019, coal imports decreased rapidly, by 14%/year, and then dropped by 42% in 2020 to 6 Mt.
Source: Netherlands energy report
Interactive Chart Netherlands Coal and Lignite Production & Consumption
Source: Global Energy & CO2 data
Benefit from up to 2 000 up-to-date data series for 186 countries in Global Energy & CO2 data
View the detailed consumption trends at country level (graphs, tables, analysis) in the Netherlands energy report
Netherlands Renewable in % Electricity Production
EZK is in charge of renewable energy policy, including the Stimulation of Sustainable Energy Production (SDE++ since 2020, Stimulering Duurzame Energieproductie) programme.
Source: Netherlands energy report
Interactive Chart Netherlands Share of Renewables in Electricity Production (incl hydro)
Source: Global Energy & CO2 data
Benefit from up to 2 000 up-to-date data series for 186 countries in Global Energy & CO2 data
Learn more about renewables in the European Battery Market Analysis
Netherlands GHG emissions and CO2 emissions
In its 2024 NECP, the Netherlands replaced its former 49% reduction target in 2030 by a target of at least a 55% reduction (including land use) in 2030. A total investment budget of €300m per year has been put in place over 2018-30 to promote actions to meet this target. In 2023, the country announced that it would spend €28bn in the coming years to meet 2030 climate goals.
Source: Netherlands energy report
Interactive Chart Netherlands CO2 emissions
Source: Global Energy & CO2 data
Benefit from up to 2 000 up-to-date data series for 186 countries in Global Energy & CO2 data
View the detailed consumption trends at country level (graphs, tables, analysis) in the Netherlands energy report