New Zealand Key Figures
- Population:
- 5.34 million
- GDP growth rate:
- -0.1 %/year
- Energy independence:
- 72.6%
Data of the last year available: 2024
- Total consumption/GDP:*
- 73.0 (2015=100)
- CO2 Emissions:
- 5.34 tCO2/cap
- Rate of T&D power losses:
- 7.32%
* at purchasing power parity
View all macro and energy indicators in the New Zealand energy report
New Zealand Energy News
View all news, archive your new and create your own daily newsletters only on your topics/countries of interest with Key Energy Intelligence
New Zealand Energy Research
Benefit from up to 2 000 up-to-date data series for 186 countries in Global Energy & CO2 data
A data overview is available in the global energy statistics app
New Zealand Total Energy Production & Consumption
Total primary energy consumption peaked in 2021 and has been decreasing since then, reaching 18.5 Mtoe in 2024 (-2.5 %/year).
Graph: Primary Consumption Trends by Energy Source
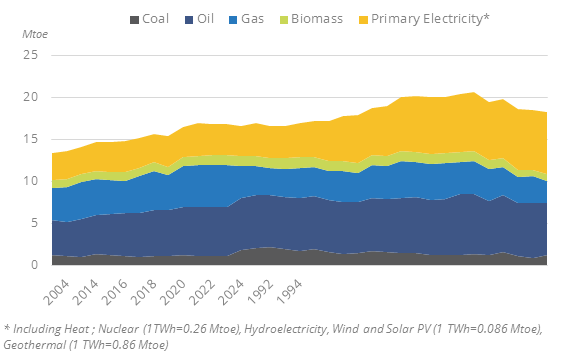
The share of natural gas has decreased by 2.3 pp since 2021 to 14.3% in 2024, while the share of primary electricity (hydro, geothermal, wind and solar) has increased by 5.3 pp to 40.5 %. Oil share has remained stable at 33%.
Source: New Zealand energy report
Interactive Chart New Zealand Total Energy Production & Consumption
Source: Global Energy & CO2 data
Benefit from up to 2 000 up-to-date data series for 186 countries in Global Energy & CO2 data
View the detailed fondamentals of the market at country level (graphs, tables, analysis) in the New Zealand energy report
New Zealand Oil Production & Consumption
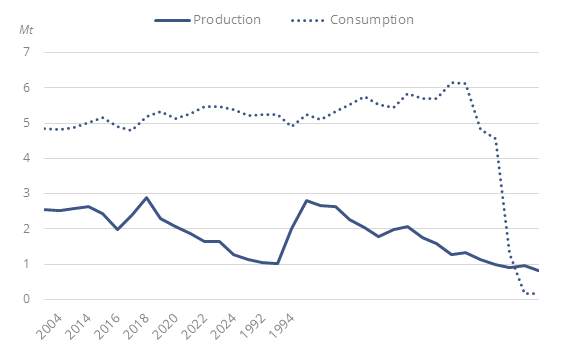
Crude oil and condensate production more than halved between 2015 and 2024, from 2.1 Mt to 0.8 Mt (-7%/year). It had already consistently decreased between 2010 and 2015 (-4%/year). The five main oil and condensate fields are Maari, Maui, Kupe, Kapuni, and Turangi (78% of the country total production). Maari and Pohokura contain 56% of the remaining oil and condensates reserves.
Graph: Crude Oil Production & Consumption
Source: New Zealand energy report
Interactive Chart New Zealand Crude Oil Production & Consumption
Source: Global Energy & CO2 data
Interactive Chart New Zealand Refined Oil Products Production & Consumption
Source: Global Energy & CO2 data
Benefit from up to 2 000 up-to-date data series for 186 countries in Global Energy & CO2 data
Additionally, for more detailed information on refineries, you can request a sample of our Asia Refineries Dataset
New Zealand Natural Gas Production & Consumption
The production of natural gas has decreased by 4%/year since 2014 to reach 3.2 bcm in 2024. The peak production was reached in 2001 with 6.5 bcm.
The six largest gas field are Maui, Mangahewa, Kupe, Turangi, Pohokura and Kapuni (96% of the country total gas production). Pohokura accounts for 38% of remaining gas reserves.
Source: New Zealand energy report
Interactive Chart New Zealand Gas Production & Consumption
Source: Global Energy & CO2 data
Benefit from up to 2 000 up-to-date data series for 186 countries in Global Energy & CO2 data
Additionally, for more detailed information on the LNG trade, you can request a sample of our Asia LNG Trade Dataset
New Zealand Coal and Lignite Production & Consumption
Coal production fell rapidly between 2010 and 2016 from 5.3 Mt to 2.9 Mt (-6%/year) and has since then decreased more slowly (2.5 Mt in 2024 of which 50% is lignite, -2%/year). Coal consumption remains relatively stable since 2016, at 2.4 Mt. Coal consumption 2021 and 2024 spikes can be explained by substitution to gas generation in 2021 due to high prices and substitution to hydro generation in 2024 due to low precipitations.
Source: New Zealand energy report
Interactive Chart New Zealand Coal and Lignite Production & Consumption
Source: Global Energy & CO2 data
Benefit from up to 2 000 up-to-date data series for 186 countries in Global Energy & CO2 data
View the detailed consumption trends at country level (graphs, tables, analysis) in the New Zealand energy report
New Zealand Renewable in % Electricity Production
New Zealand Energy Efficiency and Conservation Strategy (NZEECS) 2017-2022 has set a target of 90% of renewables in the power mix by 2025 (primarily hydro and geothermal). In 2023, the previous government announced an aspirational goal of 100% renewable electricity by 2030.
The second ERP (2024) includes a target of doubling renewable energy by 2050.
Source: New Zealand energy report
Interactive Chart New Zealand Share of Renewables in Electricity Production (incl hydro)
Source: Global Energy & CO2 data
Benefit from up to 2 000 up-to-date data series for 186 countries in Global Energy & CO2 data
Learn more about renewables in the Mini grid Africa & Asia markets for village electrification
New Zealand GHG emissions and CO2 emissions
In 2025, the government released its second NDC, which targets a GHG emissions reduction between 51 to 55% below 2005 levels by 2035 (compared to 50% by 2030 in the previous version of 2021).
Source: New Zealand energy report
Interactive Chart New Zealand CO2 emissions
Source: Global Energy & CO2 data
Benefit from up to 2 000 up-to-date data series for 186 countries in Global Energy & CO2 data
View the detailed consumption trends at country level (graphs, tables, analysis) in the New Zealand energy report