
- Update
-
- Format
- 3 files (PDF report, 2 Excel files)
- Pages
-
53 (Report only)
- Delivery
- Immediate by e-mail
- GENERAL OVERVIEW
- ENERGY AND CLIMATE POLICY FRAMEWORK
- ENERGY COMPANIES
- ENERGY SUPPLY AND DEMAND
- ENERGY USE AND PRICE BY SECTOR
- ISSUES AND PROSPECTS
- STATISTICS
- ABBREVIATIONS
- GLOSSARY
Buy Jordan energy report
Price without VAT. Depending on your statute and location, VAT might be applicable. Get in touch with us for more information.
After validation, you will immediately receive 3 files by email (one pdf report and 2 excel files containing the datasets).
Overview
This analysis includes a comprehensive Jordan energy market report and updated datasets. It is derived from the most recent key economic indicators, supply and demand factors, oil and gas pricing trends and major energy issues and developments surrounding the energy industry. The report provides a complete picture of the country situation, dynamics, current issues and future prospects. With market data and continuous follow-up of markets news, this report brings clear and concise insights with which to tackle national energy challenges and opportunities. Browse the tabs below for a detailed table of contents, the list of graphs and tables, and details on the data files.
Highlights
- Jordan aims to reduce its GHG emissions by 31% in 2030.
- IPPs supply most of the power generation (72%), along with State owned utility SEPCO (28%).
- NPC, the public gas company, aims to achieve a production of 2 bcm/year by 2030.
- The country has large oil shale and solar resources.
- Gas accounted for 59% of the power mix in 2023 and renewables for 25%.
- The final energy consumption has fluctuated around 6 Mtoe since 2016.
- Oil supplies 62% of this consumption.
- Electricity prices remained stable in 2024 and diesel prices fell by 9%.
- Electricity demand should grow by an average of 6.5%/year until 2030.
- Masdar will develop a 1 GW wind project.
- The country is showing interest in developing SMRs.
Energy & Climate Policy Framework
The Ministry of Energy and Mineral Resources (MEMR) coordinates the energy sector.
EMRC, the Energy and Minerals Regulatory Commission regulates the energy sector; it was created in 2014 by merging several regulatory bodies (Nuclear Regulatory Commission, Natural Resources Authority and Electricity Regulatory Commission).
Energy Companies
Electricity:
SEPCO, Samra Electric Power Company (100% state-owned), is the main generator with a total capacity of 1.5 GW and a production of 6.2 TWh in 2023 (29% of conventional power generation). The company operates the Samra gas-fired power plant (1.24 GW) and a renewable capacity of 255 MW (175 MW of solar and 80 MW of wind).
Energy Supply & Demand
Resources:
Jordan is relatively poor in conventional energy resources (gas reserves estimated at 6 bcm).
The country is considered to have significant oil shale resources estimated at 5 242 mbl by the US Geological Survey (2006).
Jordan also has large wind and solar resources (among the highest irradiance level in the world, at around 6.4 kWh/m2/d).
Energy Use and Price by Sector
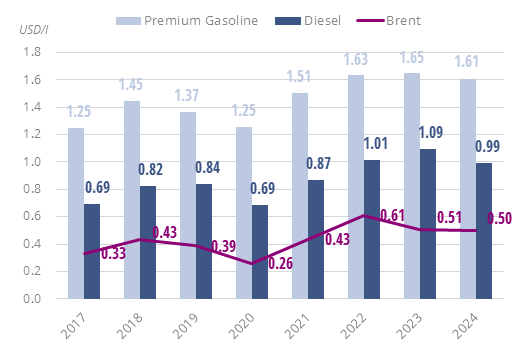
Energy Prices in Transport:
In 2024, the price of diesel reached US$0.99/l (-9%) and that of gasoline US$1.61/l (-2%). Prices have increased regularly since 2020 (+28% for gasoline and +45% for diesel)
Graph: Energy Prices in Transport (Taxes Included)
Issues & Prospects
Electricity:
According to the Ministry, electricity demand should grow by an average of 6.5%/year until 2030, to 52 TWh. The country's overall capacity should reach 8 GW in 2030 and 14 GW in 2040 (intermediate scenario).
- Graph 1: Primary Consumption Trends by Energy Source
- Graph 2: Total Consumption Market Share by Energy (2023)
- Graph 3: Installed Electric Capacity by Source
- Graph 4: Installed Electric Capacity by Source (2023)
- Graph 5: Gross Power Production by Source & Consumption
- Graph 6: Power Generation by Source (2023)
- Graph 7: Crude Oil Production & Consumption
- Graph 8: Petroleum Products Production & Consumption
- Graph 9: Gas Production & Consumption
- Graph 10: Coal Production & Consumption
- Graph 11: GHG Emissions and CO2-energy Emissions
- Graph 12: Final Demand Trends by Energy Source
- Graph 13: Final Consumption by Sector
- Graph 14: Final Consumption Market Share by Sector (2023)
- Graph 15: Final Consumption in Industry by Energy Source
- Graph 16: Energy Prices Including Taxes in Industry
- Graph 17: Final Consumption in Transport by Energy Source
- Graph 18: Energy Prices Including Taxes in Transport
- Graph 19: Final Consumption in Residential, Services, Agriculture by Energy Source
- Graph 20: Energy Prices Including Taxes in Residential
- Graph 21: Upcoming New Capacity by Energy Source
- Economic Indicators: Annual historical data including population, GDP growth, imports and exports, inflation rate, energy security and efficiency indicators, CO2 emissions.
- Supply Indicators: Historical data including oil and gas reserves, electric and refining capacity, energy production, power production and external trade. All are detailed by energy source.
- Demand Indicators: Historical data including consumption per inhabitant, consumption trends, total consumption by energy source, final consumption by energy source and sector, and electricity consumption by sector.
- Energy Balances: Single table displaying the overall energy industry balance per annum, also graphically displayed by energy sub-segment.
The Jordan energy market data since 1990 and up to
is included in the Excel file accompanying the Jordan country report.
It showcases the historical evolution, allowing users to easily work with the data.
Key Data included in the excelsheet:
- Economic indicators: Annual historical economic indicators, energy security, energy efficiency and CO2 emissions.
- Supply indicators: Annual historical reserves, capacity, production and external trade (imports(+) exports(-) balance).
- Demand indicators: Annual historical consumption per capita, consumption trends, total consumption, final consumption (per energy and per sector) and electricity consumption total and per sector.
- Energy Balance: total and per energy.
- Jordan Energy Prices: In addition to the analysis provided on the report we also provided a data set which includes historical details on the Jordan energy prices for the follow items: price of premium gasoline (taxes incl.), price of diesel (taxes incl.), price of electricity in industry (taxes incl.), price of electricity for households (taxes incl.), price of natural gas in industry (taxes incl.), prices of natural gas for households (taxes incl.), spot price of Brent and CO2 emissions (from fuel combustion).