Türkiye Key Figures
- Population:
- 85.5 million
- GDP growth rate:
- 3.18 %/year
- Energy independence:
- 33.5%
Data of the last year available: 2024
- Total consumption/GDP:*
- 80.1 (2005=100)
- CO2 Emissions:
- 4.54 tCO2/capita
- Rate of T&D power losses:
- 10.1%
* at purchasing power parity
View all macro and energy indicators in the Türkiye energy report
Türkiye Energy News
View all news, archive your new and create your own daily newsletters only on your topics/countries of interest with Key Energy Intelligence
Türkiye Energy Research
Benefit from up to 2 000 up-to-date data series for 186 countries in Global Energy & CO2 data
A data overview is available in the global energy statistics app
Türkiye Total Energy Production & Consumption
Total consumption per capita is around 1.9 toe (2024) (of which, around 3 600 kWh of electricity) compared to about 2.8 toe for the EU.
Total energy consumption increased by 6% in 2024 to around 170 Mtoe, after remaining stable in 2023 and decreasing in 2022, due to substantial price hikes in transport and industry. Before that, it increased by more than 8% in 2021, and had previously been stable at around 147 Mtoe over 2017-2020, in a context of low economic growth. Total energy consumption had been growing at a rapid pace between 2000 and 2017 (around 5%/year).
Source: Türkiye energy report
Interactive Chart Türkiye Total Energy Production & Consumption
Source: Global Energy & CO2 data
Benefit from up to 2 000 up-to-date data series for 186 countries in Global Energy & CO2 data
View the detailed fondamentals of the market at country level (graphs, tables, analysis) in the Türkiye energy report
Türkiye Oil Production & Consumption
Türkiye covers only 16% of its total oil needs with a production of 6.5 Mt of crude oil (2024).
The total refining capacity of 0.8 mb/d is distributed over 6 refineries, including 2 large ones belonging to Tupras: Izmir and Izmit (0.2 mb/d each). The STAR refinery (0.2 mb/d) was completed in 2018 by Socar.
In 2024, net crude and oil product imports reached 58 Mt, close to the 2016-2019 average. The share of crude in that amount has surged to around 60% since 2019, from 43% in 2018, due to the STAR refinery starting operations.
Source: Türkiye energy report
Interactive Chart Türkiye Crude Oil Production & Consumption
Source: Global Energy & CO2 data
Interactive Chart Türkiye Refined Oil Products Production & Consumption
Source: Global Energy & CO2 data
Benefit from up to 2 000 up-to-date data series for 186 countries in Global Energy & CO2 data
Additionally, for more detailed information on refineries, you can request a sample of our EMEA Refineries Dataset
Türkiye Natural Gas Production & Consumption
Gas consumption increased by 5% in 2024, reaching 53 bcm. It remained stable in 2023 at around 50 bcm, after a significant 12% drop in 2022, driven by large price increases and reduced consumption from power plants. It had previously surged by 32% over 2019-2021, due to high economic growth and low hydropower availability.
Between 2000 and 2014, gas consumption grew very rapidly (9%/year), but growth since then has been lower and more chaotic, depending on gas-fired power generation needs and due to efforts to limit consumption through price hikes (notably in 2018 and 2019).
Source: Türkiye energy report
Interactive Chart Türkiye Gas Production & Consumption
Source: Global Energy & CO2 data
Benefit from up to 2 000 up-to-date data series for 186 countries in Global Energy & CO2 data
Additionally, for more detailed information on the LNG trade, you can request a sample of our EMEA LNG Trade Dataset
Türkiye Coal and Lignite Production & Consumption
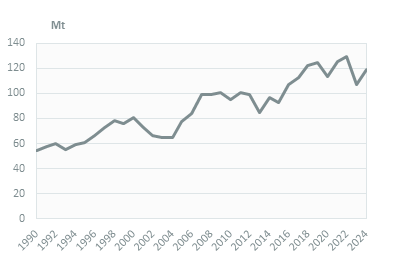
Coal and lignite consumption increased significantly in 2024 (+11%), reaching 119 Mt. It dropped abruptly (-17%) in 2023, after a very rapid increase between 2020 and 2022 (7%/year), driven by the power sector. Coal and lignite consumption rose by 8%/year over 2015-2019.
Of the total demand, 80% is used to produce electricity, 10% is consumed by industry, and the remainder is consumed by buildings.
Graph: COAL CONSUMPTION (Mt)
Source: Türkiye energy report
Interactive Chart Türkiye Coal and Lignite Production & Consumption
Source: Global Energy & CO2 data
Benefit from up to 2 000 up-to-date data series for 186 countries in Global Energy & CO2 data
View the detailed consumption trends at country level (graphs, tables, analysis) in the Türkiye energy report
Türkiye Power Production & Consumption
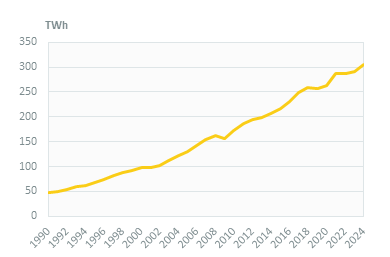
Electricity consumption increased by 5% in 2024, reaching 305 TWh, in line with its historical trend over 2010-2018. It remained stable between 2021 and 2023, despite 5% GDP growth, because of high energy prices. It grew by 9% in 2021, after remaining stable from 2018 to 2020.
Industry absorbs the highest share, with 44%, followed by services (27%) and residential (23%).
Graph: ELECTRICITY CONSUMPTION (TWh)
Source: Türkiye energy report
Interactive Chart Türkiye Power Production & Consumption
Source: Global Energy & CO2 data
Benefit from up to 2 000 up-to-date data series for 186 countries in Global Energy & CO2 data
View the detailed consumption trends at country level (graphs, tables, analysis) in the Türkiye energy report
Türkiye Renewable in % Electricity Production
The General Directorate of Renewable Energy of MENR is in charge of implementing policy on renewables.
As part of the National Energy Plan 2022-2035, renewables are expected to account for 75% of the new power capacity that will be commissioned and will make up 65% of total capacity in 2035 (58.5% in 2023).
Source: Türkiye energy report
Interactive Chart Türkiye Share of Renewables in Electricity Production (incl hydro)
Source: Global Energy & CO2 data
Benefit from up to 2 000 up-to-date data series for 186 countries in Global Energy & CO2 data
Learn more about renewables in the European Battery Market Analysis
Türkiye GHG emissions and CO2 emissions
In its updated NDC (2023), Türkiye pledged to cut its GHG emissions in 2030 by 41% below a BAU scenario (compared to 21% in its initial NDC). This would limit GHG emissions to 695 MtCO2eq (incl. LULUCF), which still corresponds to a level around 60% higher than 2012 level. Türkiye also intends to peak its emissions in 2038 at the latest and achieve net zero by 2053.
Source: Türkiye energy report
Interactive Chart Türkiye CO2 emissions
Source: Global Energy & CO2 data
Benefit from up to 2 000 up-to-date data series for 186 countries in Global Energy & CO2 data
View the detailed consumption trends at country level (graphs, tables, analysis) in the Türkiye energy report