Australia Key Figures
- Population:
- 26.8 million
- GDP growth rate:
- 1.04 %/year
- Energy independence:
- 100%
Data of the last year available: 2024
- Total consumption/GDP:*
- 71.3 (2005=100)
- CO2 Emissions:
- 13.5 tCO2/capita
- Rate of T&D power losses:
- 4.79%
* at purchasing power parity
View all macro and energy indicators in the Australia energy report
Australia Energy News
View all news, archive your new and create your own daily newsletters only on your topics/countries of interest with Key Energy Intelligence
Australia Energy Research
Benefit from up to 2 000 up-to-date data series for 186 countries in Global Energy & CO2 data
A data overview is available in the global energy statistics app
Australia Total Energy Production & Consumption
Per capita energy consumption is around 25% higher than the average of OECD countries, amounting to 4.9 toe/cap in 2024, while per capita electricity consumption was 9.4 MWh/cap.
Total energy consumption has increased slightly since 2022 (by around 1%/year, after decreasing by 2.5%/year from 2020 to 2022. It fluctuated between 130 and 135 Mtoe between 2010 and 2020.
Source: Australia energy report
Interactive Chart Australia Total Energy Production & Consumption
Source: Global Energy & CO2 data
Benefit from up to 2 000 up-to-date data series for 186 countries in Global Energy & CO2 data
View the detailed fondamentals of the market at country level (graphs, tables, analysis) in the Australia energy report
Australia Oil Production & Consumption
Australia's production of liquid hydrocarbons (crude oil, condensates, and NGLs) decreased by 7%/year as from 2020 to 15 Mt in 2024, after an increase of over 40% between 2018 and 2020, reaching 20 Mt. Oil production halved between its peak at 32 Mt in 2000 and 2024, due to the decline in production from mature basins. The production is mostly due to its two largest producing basins, the Browse and Carnarvon basins in north-western Australia.
Since 2021, Australia has become a net exporter of crude oil (4.6 Mt net in 2024, with 13 Mt exported).
Source: Australia energy report
Interactive Chart Australia Crude Oil Production & Consumption
Source: Global Energy & CO2 data
Interactive Chart Australia Refined Oil Products Production & Consumption
Source: Global Energy & CO2 data
Benefit from up to 2 000 up-to-date data series for 186 countries in Global Energy & CO2 data
Additionally, for more detailed information on refineries, you can request a sample of our Asia Refineries Dataset
Australia Natural Gas Production & Consumption
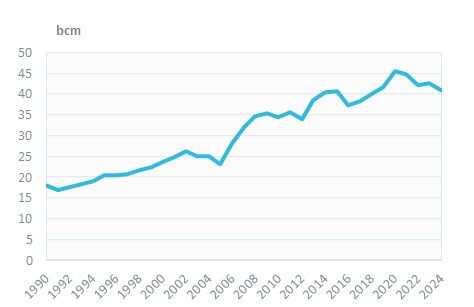
Natural gas consumption has been decreasing since 2020 to 41 bcm in 2024 (-2.5%/year on average), after a rapid increase between 2006 and 2020 (+4.4%/year on average). This increase was mainly driven by the development of gas-fired power capacity and the explosion of the LNG sector.
Electricity production accounts for 32% of gas consumption, industry for 23%, and residential and services for 12%.
Graph: NATURAL GAS CONSUMPTION (bcm)
Source: Australia energy report
Interactive Chart Australia Gas Production & Consumption
Source: Global Energy & CO2 data
Benefit from up to 2 000 up-to-date data series for 186 countries in Global Energy & CO2 data
Additionally, for more detailed information on the LNG trade, you can request a sample of our Asia LNG Trade Dataset
Australia Coal and Lignite Production & Consumption
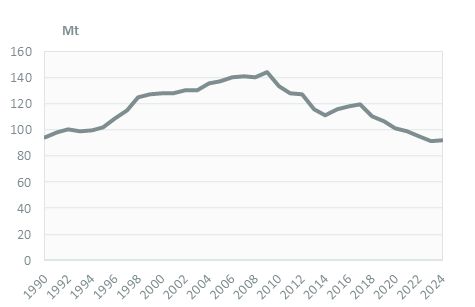
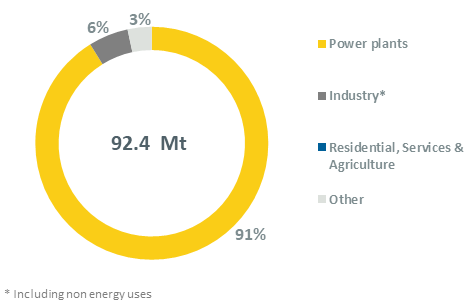
Coal and lignite consumption has declined by 36% since its peak in 2009, reaching 92 Mt in 2024. Most of the consumption goes to power generation (91%) and the remainder to industry.
Graph: COAL CONSUMPTION (Mt)
Graph: COAL CONSUMPTION BREAKDOWN BY SECTOR (2024, %)
Source: Australia energy report
Interactive Chart Australia Coal and Lignite Production & Consumption
Source: Global Energy & CO2 data
Benefit from up to 2 000 up-to-date data series for 186 countries in Global Energy & CO2 data
View the detailed consumption trends at country level (graphs, tables, analysis) in the Australia energy report
Australia Power Production & Consumption
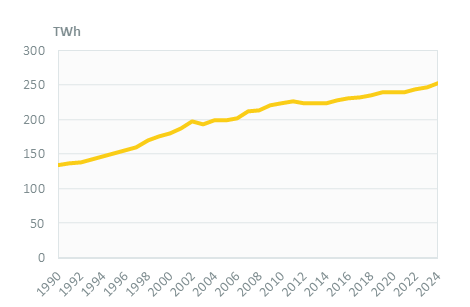
Electricity consumption increased steadily between 2015 and 2024, by 1.2%/year on average, reaching 252 TWh in 2024.
Industry is the largest user of electricity, with a decreasing market share (32% in 2024, -6 pp since 2010), followed by households (28%), services (26%), and the energy sector hydrocarbon and coal mining and processing ("others").
Graph: ELECTRICITY CONSUMPTION (TWh)
Graph: ELECTRICITY CONSUMPTION BREAKDOWN BY SECTOR (2024, %)
Source: Australia energy report
Interactive Chart Australia Power Production & Consumption
Source: Global Energy & CO2 data
Benefit from up to 2 000 up-to-date data series for 186 countries in Global Energy & CO2 data
View the detailed consumption trends at country level (graphs, tables, analysis) in the Australia energy report
Australia GHG emissions and CO2 emissions
In 2022, Australia raised its carbon emission reduction target to 43% by 2030 (from 2005 levels), up from the previous target of between 26% and 28% set in its updated NDC. GHG emissions decreased by 28% between 2005 and 2024 from 613 MtCO2eq down to 441 MtCO2eq, with the goal of 350 MtCO2eq in 2030. Most emission reductions were achieved in the land and electricity sectors, while other sectors (industry and waster, resources, transport) are 13% above 2005 levels.
Source: Australia energy report
Interactive Chart Australia CO2 emissions
Source: Global Energy & CO2 data
Benefit from up to 2 000 up-to-date data series for 186 countries in Global Energy & CO2 data
View the detailed consumption trends at country level (graphs, tables, analysis) in the Australia energy report