India Key Figures
- Population:
- 1451 million
- GDP growth rate:
- 6.48 %/year
- Energy independence:
- 65.4%
Data of the last year available: 2024
- Total consumption/GDP:*
- 85.1 (2015=100)
- CO2 Emissions:
- 2.22 tCO2/cap
- Rate of T&D power losses:
- 16.7%
* at purchasing power parity
View all macro and energy indicators in the India energy report
India Energy News
View all news, archive your new and create your own daily newsletters only on your topics/countries of interest with Key Energy Intelligence
India Energy Research
Benefit from up to 2 000 up-to-date data series for 186 countries in Global Energy & CO2 data
A data overview is available in the global energy statistics app
India Total Energy Production & Consumption
Primary consumption increased by 6.5%/year since 2020 to reach 1 213 Mtoe in 2024, compared to a slower growth before (4.6%/year over 2010-2019). Total energy consumption per capita reached 0.8 toe (2024), half the Asian average.
Graph: Primary Consumption Trends by Energy Source
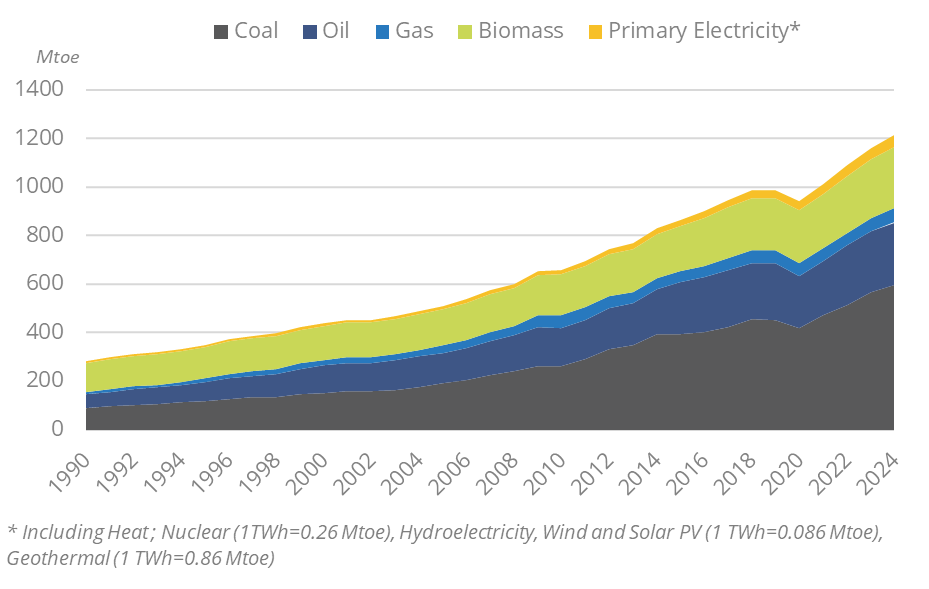
Source: India energy report
Interactive Chart India Total Energy Production & Consumption
Source: Global Energy & CO2 data
Benefit from up to 2 000 up-to-date data series for 186 countries in Global Energy & CO2 data
View the detailed fondamentals of the market at country level (graphs, tables, analysis) in the India energy report
India Oil Production & Consumption
Oil production has declined by 24% since 2010, reaching 32 Mt in 2024 (-13% since 2019).
India is the world's third largest importer of crude oil, reaching its highest level in 2024 at 241 Mt (+2.8%/year since 2010). In 2024, crude oil imports represented 93% of the country's oil needs. The country is a net oil product exporter (13 Mt in 2024), although its net exports have fallen by 56% since 2018.
Graph: Crude Oil Production & Consumption
Source: India energy report
Interactive Chart India Crude Oil Production & Consumption
Source: Global Energy & CO2 data
Interactive Chart India Refined Oil Products Production & Consumption
Source: Global Energy & CO2 data
Benefit from up to 2 000 up-to-date data series for 186 countries in Global Energy & CO2 data
Additionally, for more detailed information on refineries, you can request a sample of our Asia Refineries Dataset
India Natural Gas Production & Consumption
Natural gas production has increased by 6%/year since 2020, reaching 37 bcm in 2024, after a 2.7%/year decline between 2014 and 2020.
In 2020, ONGC began to produce gas from the KG-DWN98/2 block (Cluster 2 project) in the Bay of Bengal. The US$5.1bn project is forecast to provide up to 17 mcm/d of gas (6.2 bcm/year). Production from the deepest well U1B started at the end of 2021.
Source: India energy report
Interactive Chart India Gas Production & Consumption
Source: Global Energy & CO2 data
Benefit from up to 2 000 up-to-date data series for 186 countries in Global Energy & CO2 data
Additionally, for more detailed information on the LNG trade, you can request a sample of our Asia LNG Trade Dataset
India Coal and Lignite Production & Consumption
Total coal and lignite production increased by 5% in 2024 to almost 1.1 Gt, its highest level (+7%/year since 2019). The average progression over 2015-2019 was around 3%/year.
Source: India energy report
Interactive Chart India Coal and Lignite Production & Consumption
Source: Global Energy & CO2 data
Benefit from up to 2 000 up-to-date data series for 186 countries in Global Energy & CO2 data
View the detailed consumption trends at country level (graphs, tables, analysis) in the India energy report
India Renewable in % Electricity Production
IREDA, the Indian Renewable Energy Development Agency, finances the development of renewables.
Source: India energy report
Interactive Chart India Share of Renewables in Electricity Production (incl hydro)
Source: Global Energy & CO2 data
Benefit from up to 2 000 up-to-date data series for 186 countries in Global Energy & CO2 data
Learn more about renewables in the Mini grid Africa & Asia markets for village electrification
India GHG emissions and CO2 emissions
In its updated NDC (2022), the country reiterated a target to reduce its CO2 emission intensity of GDP by 45% in 2030, compared to 2005 levels. In 2021, the country pledged to reach net-zero emissions in 2070.
Source: India energy report
Interactive Chart India CO2 emissions
Source: Global Energy & CO2 data
Benefit from up to 2 000 up-to-date data series for 186 countries in Global Energy & CO2 data
View the detailed consumption trends at country level (graphs, tables, analysis) in the India energy report