Jordan Key Figures
- Population:
- 11.4 million
- GDP growth rate:
- 2.88 %/year
- Energy independence:
- 30.8%
Data of the last year available: 2023
- Total consumption/GDP:*
- 99.7 (2015=100)
- CO2 Emissions:
- 1.72 tCO2/cap
- Rate of T&D power losses:
- 13.4%
* at purchasing power parity
View all macro and energy indicators in the Jordan energy report
Jordan Energy News
View all news, archive your new and create your own daily newsletters only on your topics/countries of interest with Key Energy Intelligence
Jordan Energy Research
Benefit from up to 2 000 up-to-date data series for 186 countries in Global Energy & CO2 data
A data overview is available in the global energy statistics app
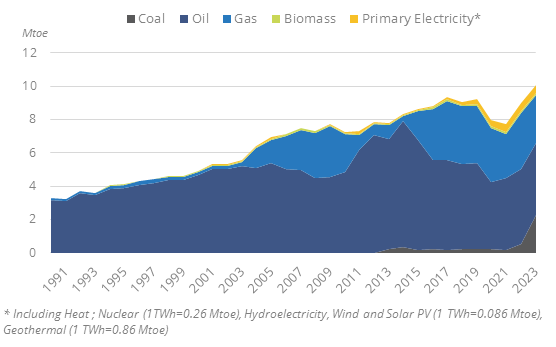
Jordan Total Energy Production & Consumption
The country's total energy consumption has increased very rapidly since 2021, by 14%/year to around 10.3 Mtoe in 2023. Consumption per capita reached 0.9 toe/cap.
Oil is the country's main energy source, with 41% of total consumption, followed by natural gas with 28%, oil shales (22%) and renewables (6%).
Graph: Primary Consumption Trends by Energy Source
Graph: Total Consumption Market Share by Energy (2023)
Source: Jordan energy report
Interactive Chart Jordan Total Energy Production & Consumption
Source: Global Energy & CO2 data
Benefit from up to 2 000 up-to-date data series for 186 countries in Global Energy & CO2 data
View the detailed fondamentals of the market at country level (graphs, tables, analysis) in the Jordan energy report
Jordan Oil Production & Consumption
Jordan imported 2 Mt of crude oil in 2023, an increase of 16%, following a 15% decreasein 2021. This increase follows a long-term increasing trend of crude oil and oil products between 2010-2015, which was related to a significant rise in the consumption of fuel oil for electricity generation.
The crude oil used in the country is imported mainly from Saudi Arabia (79% in 2022).
Source: Jordan energy report
Interactive Chart Jordan Crude Oil Production & Consumption
Source: Global Energy & CO2 data
Interactive Chart Jordan Refined Oil Products Production & Consumption
Source: Global Energy & CO2 data
Benefit from up to 2 000 up-to-date data series for 186 countries in Global Energy & CO2 data
Additionally, for more detailed information on refineries, you can request a sample of our EMEA Refineries Dataset
Jordan Natural Gas Production & Consumption
Gas production, which began in 1989 (Risha fields), is limited (0.2 bcm in 2023). It is used for electricity generation. The country imported 3.6 bcm of natural gas in 2023 (-14%), mostly from Israel (83%) and the rest from Egypt.
A 15.5 km-long gas pipeline to export gas from the Leviathan field in Israel to Jordan was commissioned in 2019. It was laid near the southern end of the Dead Sea. Noble Energy and the Leviathan partners will supply 45 bcm of natural gas from the field over 15 years(3 bcm/year). Transit has been interrupted since the conflict in Israel.
Source: Jordan energy report
Interactive Chart Jordan Gas Production & Consumption
Source: Global Energy & CO2 data
Benefit from up to 2 000 up-to-date data series for 186 countries in Global Energy & CO2 data
Additionally, for more detailed information on the LNG trade, you can request a sample of our EMEA LNG Trade Dataset
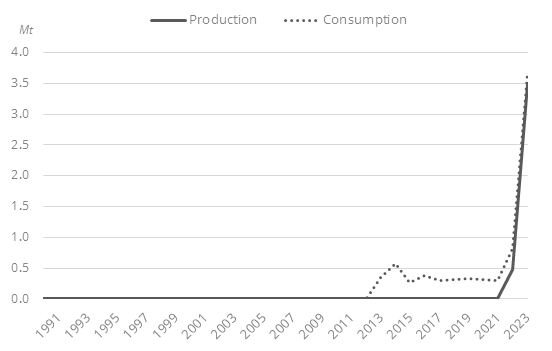
Jordan Coal and Lignite Production & Consumption
Jordan has the world's fifth largest oil shale deposit. The country began exploiting these resources in 2022 to supply part of its electricity production (production of 3.5 Mt in 2023.
Graph: Coal Production & Consumption
Source: Jordan energy report
Interactive Chart Jordan Coal and Lignite Production & Consumption
Source: Global Energy & CO2 data
Benefit from up to 2 000 up-to-date data series for 186 countries in Global Energy & CO2 data
View the detailed consumption trends at country level (graphs, tables, analysis) in the Jordan energy report
Jordan Renewable in % Electricity Production
The Renewable Energy Law (2012) aimed for 10% of the country's power capacity mix to come from renewables in 2020, corresponding to a capacity of 1 800 MW, mainly from wind (1 200 MW) and solar (600 MW). This target was reached, as around 2 GW were installed, and solar and wind accounted for 20% of the power capacity mix in 2020. The country has raised its target for the share of renewables in the power capacity mix from 31% to 50% by 2030.
In the National Energy Strategy, the share of renewables in the total energy mix should reach 14% in 2030.
Source: Jordan energy report
Interactive Chart Jordan Share of Renewables in Electricity Production (incl hydro)
Source: Global Energy & CO2 data
Benefit from up to 2 000 up-to-date data series for 186 countries in Global Energy & CO2 data
Jordan GHG emissions and CO2 emissions
In its updated NDC, Jordan strives to reduce its greenhouse gas emissions by 31% in 2030. A maximum of 5% of this reduction contribution will be unconditionally fulfilled by the country's own means compared to a BAU scenario. The country aims to improve efficient energy consumption in all sectors by 9%.
Source: Jordan energy report
Interactive Chart Jordan CO2 emissions
Source: Global Energy & CO2 data
Benefit from up to 2 000 up-to-date data series for 186 countries in Global Energy & CO2 data
View the detailed consumption trends at country level (graphs, tables, analysis) in the Jordan energy report